Highlights:
- National home sales were up 1.3% on a month-over-month basis in October.
- Actual (not seasonally adjusted) monthly activity came in 36% below October 2021.
- The number of newly listed properties edged up 2.2% month-over-month.
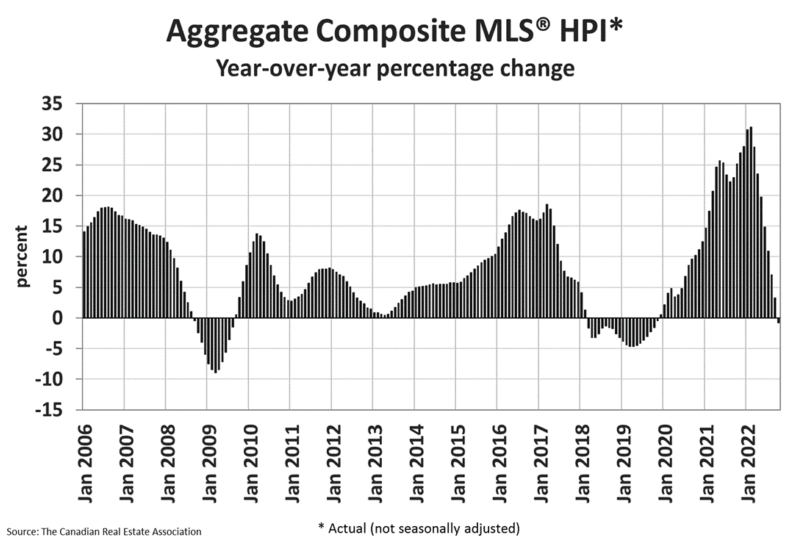
- The MLS® Home Price Index (HPI) declined by 1.2% month-over-month and was down 0.8% year-over-year.
- The actual (not seasonally adjusted) national average sale price posted a 9.9% year-over-year decline in October.
Home sales recorded over Canadian MLS® Systems edged up by 1.3% between September and October 2022. While not a large increase, it was significant in that it was the first monthly gain since February.
About 60% of all local markets saw sales rise in October, although both gains and declines were generally small across the board. The largest gain, a 6% increase in Greater Vancouver, was offset by a 2.4% decrease in activity in Montreal.
The actual (not seasonally adjusted) number of transactions in October 2022 came in 36% below that same month last year, and stood about 15% below the pre-COVID-19 10-year average for the month.
“In October, sales across the country increased for the first time since before interest rates started to rise last winter,” said Jill Oudil, Chair of CREA. “Of course, we’ve known the demand was there, so it’s just been a matter of some playing the waiting game as borrowing costs and prices have adjusted. Moving into 2023, sellers and buyers will likely continue coming off the sidelines, but it’s a very different market compared to just one year ago. As always, for information and guidance about how to navigate the current marketplace, your best bet is to contact your local REALTOR®,” continued Oudil.
“October provided another month’s worth of data suggesting the slow down in Canadian housing markets is winding up,” said Shaun Cathcart, CREA’s Senior Economist. “Sales actually popped up from September to October, and the decline in prices on a month-to-month basis got smaller for the fourth month in a row."
The number of newly listed homes was up 2.2% on a month-over-month basis in October, with gains in the Greater Toronto Area (GTA) and the B.C. Lower Mainland offsetting declines in Montreal and Halifax-Dartmouth.
With sales up by a little less than new listings in October, the sales-to-new listings ratio eased back to 51.6% compared to 52% in September. The long-term average for this measure is 55.1%.
There were 3.8 months of inventory on a national basis at the end of October 2022, up slightly from 3.7 months at the end of September. While the number of months of inventory is still well below the long-term average of about five months, it is also up quite a bit from the all-time low of 1.7 months set at the beginning of 2022.
The Aggregate Composite MLS® Home Price Index (HPI) edged down 1.2% on a month-over-month basis in October 2022, the smallest decline since June.
The non-seasonally adjusted Aggregate Composite MLS® HPI edged down 0.8% on a year-over-year basis in October.
The actual (not seasonally adjusted) national average home price was $644,643 in October 2022, down 9.9% from the same month last year. The national average price is heavily influenced by sales in Greater Vancouver and the GTA, two of Canada’s most active and expensive housing markets. Excluding these two markets from the calculation cuts almost $125,000 from the national average price.
Provided by: CREA